
Digital Circuits - Algorithmic State Machines


Every digital system can be partitioned into two parts. Those are data path (digital) circuits and control circuits. Data path circuits perform the functions such as storing of binary information (data) and transfer of data from one system to the other system. Whereas, control circuits determine the flow of operations of digital circuits.
It is difficult to describe the behavior of large state machines using state diagrams. To overcome this difficulty, Algorithmic State Machine (ASM) charts can be used. ASM charts are similar to flow charts. They are used to represent the flow of tasks to be performed by data path circuits and control circuits.

Basic Components of ASM charts

Following are the three basic components of ASM charts.
  • State box
  • Decision box
  • Conditional output box

State box

State box is represented in rectangular shape. Each state box represents one state of the sequential circuit. The symbol of state box is shown in the following figure.
State Box
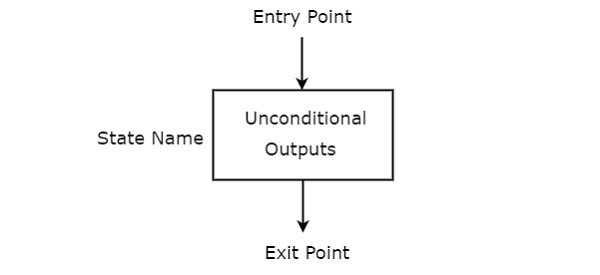
It is having one entry point and one exit point. Name of the state is placed to the left of state box. The unconditional outputs corresponding to that state can be placed inside state box. Moore state machine outputs can also be placed inside state box.

Decision box

Decision box is represented in diamond shape. The symbol of decision box is shown in the following figure.
Decision Box
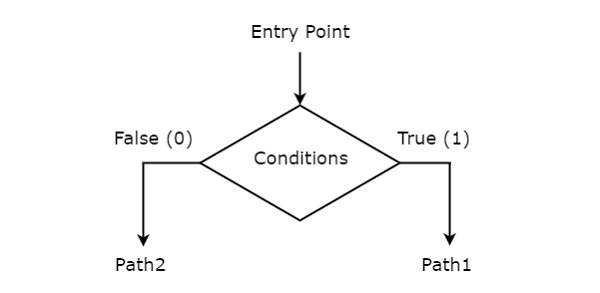
It is having one entry point and two exit paths. The inputs or Boolean expressions can be placed inside the decision box, which are to be checked whether they are true or false. If the condition is true, then it will prefer path1. Otherwise, it will prefer path2.

Conditional output box

Conditional output box is represented in oval shape. The symbol of conditional output box is shown in the following figure.
Conditional output box
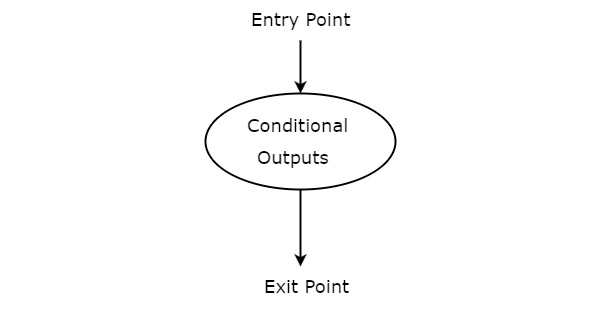
It is also having one entry point and one exit point similar to state box. The conditional outputs can be placed inside state box. In general, Mealy state machine outputs are represented inside conditional output box. So, based on the requirement, we can use the above components properly for drawing ASM charts.

Comments

Popular posts from this blog

Discrete Mathematics - Rules of Inference

To deduce new statements from the statements whose truth that we already know,  Rules of Inference  are used. What are Rules of Inference for? Mathematical logic is often used for logical proofs. Proofs are valid arguments that determine the truth values of mathematical statements. An argument is a sequence of statements. The last statement is the conclusion and all its preceding statements are called premises (or hypothesis). The symbol “ ∴ ∴ ”, (read therefore) is placed before the conclusion. A valid argument is one where the conclusion follows from the truth values of the premises. Rules of Inference provide the templates or guidelines for constructing valid arguments from the statements that we already have. Table of Rules of Inference Rule of Inference Name Rule of Inference Name P ∴ P ∨ Q P ∴ P ∨ Q Addition P ∨ Q ¬ P ∴ Q P ∨ Q ¬ P ∴ Q Disjunctive Syllogism P Q ∴ P ∧ Q P Q ∴ P ∧ Q Conjunction P → Q Q → R ∴ P → R P → Q Q → R ∴ P → R ...

5 best private search engines and why you need to use them.

5 best private search engines and why you need to use them  By:  Boniyeamin laju   ▪   May 31, 2019   ▪ 3 minute read 5 best private search engines and why you need to use  Normal browsers like Google and Bing are designed to track users’ activities and profile their online behavior. The primary reason for this is to create advertisements that will be attractive to the user. However, there-there is always the concern of  personal information being compromised  due to security breaches, state surveillance, and unauthorized data sharing. Fortunately,  private search engines  can help keep your private information safe. Simply put, Private Search Engines, also known as PSE, uses proxy and encrypted search request to  hide your personal information  from anyone looking to misuse your information. Below you will find more information about what a PSE is, how it works, and wh...

discrete mathematics: Venn Diagrams

Venn Diagrams Venn diagram, invented in 1880 by John Venn, is a schematic diagram that shows all possible logical relations between different mathematical sets. Examples Set Operations Set Operations include Set Union, Set Intersection, Set Difference, Complement of Set, and Cartesian Product. Set Union The union of sets A and B (denoted by  A ∪ B A ∪ B ) is the set of elements which are in A, in B, or in both A and B. Hence,  A ∪ B = { x | x ∈ A   O R   x ∈ B } A ∪ B = { x | x ∈ A   O R   x ∈ B } . Example  − If  A = { 10 , 11 , 12 , 13 } A = { 10 , 11 , 12 , 13 }  and B =  { 13 , 14 , 15 } { 13 , 14 , 15 } , then  A ∪ B = { 10 , 11 , 12 , 13 , 14 , 15 } A ∪ B = { 10 , 11 , 12 , 13 , 14 , 15 } . (The common element occurs only once) Set Intersection The intersection of sets A and B (denoted by  A ∩ B A ∩ B ) is the set of elements which are in both A and B. Hence,  A ∩ B = { x | x ∈ A   A N D...